
Page 675 - 2015-37
P. 675
Yi ∫ (Q1,Q2,Q3,Q4,Q5,Q6,Q7,Q8,Q9,Q10 υi) (4)
Where
Y (independent Variable) is 1, if a farmer adopts improved crop
production technology and 0, if he does not,
Q1 = «fadama» participant
Q2 = Marital Status
Q3 = Age {continuous variable}
Q4 = Household size {continuous variable}
Q5 = Status of respondents
Q6 = Education
Q7 = Primary Occupation
Q8 = Social Group
Q9 = Awareness of improved variety
Q10 = Adoption of improved technology
υi random disturbance term.
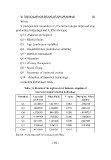
Table (1): Results of the logit model of farmers› adoption of
improved crop production technology
Variables Log odds Odds Ratio P- value Marginal Effect
estimates (dy/dx)
Q1 1.168683 3.217753 0.018
Q3 .0048729 1.004885 0.793 .1581018
Q4 -.1724501 .8416003 0.020 .0005333
Q5 -1.994489 .1360832 0.000 -.0188729
Q6 0253735 1.025698 0.870 -.1882692
Q7 1.996564 7.36371 0.000 .0027769
Cons .4632689 1.589261 0.673 .2185038
Source : Field Data (2013) Computed with Stata
- 10 -