
Page 495 - 2016 - Vol. 40
P. 495
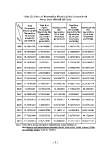
Table (2): Share of Renewables Electricity Net Generation in
                   Africa from 1998 till 2012 (%)

Total            Total Non-                         Total Non-
                      Hydro       Hydroelectricity  Hydro Hydroelectricity
  Renewable        Renewable             Net        Renewable     Net
Electricity Net  Electricity Net                    Electricity Net Generation
                   Generation       Generation      Generation (% of total
  Generation       (% of total      (% of total     (% of total renewable
  (% of total       electricity      electricity    renewable electricity)
   electricity                      generation)

generation) generation)                             electricity)

1998 16.40857945 0.407468882 16.00111056 2.483267265 97.51673273

1999 18.56439878 0.452767542 18.11163124 2.438902264 97.56109774

2000 18.35274075 0.58874099 17.76399976 3.207918632 96.79208137

2001 19.24288581 0.6391527 18.60373311 3.321501286 96.67849871

2002 18.64272623 0.577787762 18.06493847 3.099266462 96.90073354

2003 17.55541217 0.667628679 16.88778349 3.802979234 96.19702077

2004 17.56334899 0.732441278 16.83090771 4.170282551 95.82971745

2005 17.28748366 0.706431022 16.58105263 4.086372756 95.91362724

2006 17.2983094 0.815304196 16.4830052 4.713201605 95.2867984

2007 16.88382433 0.742392641 16.14143169 4.39706447 95.60293553

2008 16.93115479 0.798137021 16.1330127 4.714014083 95.28595597

2009 17.50593983 0.88988951 16.61604527 5.083357527 94.91661363

2010 18.15135518 0.992613785 17.1587414 5.46853816 94.53146184

2011 17.76339884 1.035235182 16.72816365 5.827911602 94.1720884

 2012 17.55158851 0.967579141 16.58400937 5.512772477 94.48722752

Source: United States Energy Information Administration, Region Statistics, at:
          https://www.eia.gov/cfapps/ipdbproject/iedindex3.cfm?tid=2&pid=2&aid=12&cid=r6,&syid=1998&e
          yid=2012&unit=BKWH, Visited on: 19/2/2016.

                                  -7-