
Page 496 - 2016 - Vol. 40
P. 496
98&eyid=2012&unit=BKWH, Visited on: 19/2/2016.
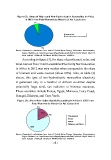
Figure (2): Share of Hydro and Non-Hydro
electric Renewables in Africa in 2012 from Total
Figure R(2e):neSwhaabrleeosfEHleycdtrroiciatnydNNeot nG-Henyedrraotieolnectric Renewables in Africa
in 2012 from Total Renewables Electricity Net Generation
6%
Hydroelectric
Non-Hydroelectric Renewables
According to figure (3), the share of geothermal, solar, and wind
sources from Total Renewables Electricity Net Generation in Africa in
2012 was very modest when comp9a4%red to the share of biomass and waste
sources (abouSoturc8e:0RR%eegsi)eoa.nrcShAteartl’issstoiccas,l,cualata:tsihotntpstsa:f/r/bwomlwewd.eai(taa.3goo)vf/cUfsanhpiptoesd/wipSdstbap,treosjetEchtn/iieesrdginydteIynxp3fo.cerfmma?totiiodfn=2A&ndpmoidin=n2i-s&traaidti=o1n2,
hydroelectric renew&caidb=lr6e,&ssyeidl=e19c9t8r&iceyiitdy=201i2s&ugniet=nBeKrWaHt,eVdisiteodnonl:y19/2i/n201a6. handful of
rSAeefsnroiecugaracnle,ShAcstEo.dotupmtusTrh:icn/nhi/eiwot:sewrtwprisaeRwiietansie.oe,sdcniedaa,oaA.esRngrucosoecdhnvpguec/itirCcoror'tfsncieaarepeSdpspcptsiaseaon/tlifiicnpsVtrgutedocilcbeantlmstporuit,rodiaodnafTtejs:ieel.glocytu/tKfiareroldeleaminnRr(dgy3eedeax)na,3,twea.cEtwfhimgnoea?fydtbsip,dhlUt=es,an2usi&rMtneeEpdiorlodea=rfScod2tg&taciratecaeitisoocdio=it,th1EnyI2env&eorNormcrgireydyba=t rliGI6,Con,&smfeooosnraaymlesisadatrsrt=,ai,1ot9nainodn
98&eyidi=n20A12f&riucnait=iBnK2W0H1, 2Viswiteadsonv:e1r9y/2/2m01o6d. est when compared to the share
of biomass and waste sources (about 80%). Also, as table (3)
shows, this type of non-hydroelectric renewables electricity
is Fgiegnuerrea(t3e)d: oSnhalyreiNnona8-HhaynddrofuellecotfriAc frican countries despite
poRteennetwiaallbyleslainrgAefrwicianidn, 2s0u1n2 frraodmiaTtiootanl or biomass resources.
ThReesneecwoaubnletrsiEesleicntrcilcuitdyeNKetenGyean,erEagtyiopnt, Morocco, Ivory Coast,
Senegal, Ethiopia, and Cape Verde.
Figure (3): Share Non-Hydro electric Renewables in Africa in 2012 from
Total Renewables Electricity Net Generation
Geothermal
Solar
Wind
Biomass and Waste
Source: Researcher’s calculations from data of United States Energy Information Administration,
Region Statistics, at: https://www.eia.gov/cfapps/ipdbproject/iedindex3.cfm?tid=2&pid=2&aid=12
&cid=r6,&syid=1998&eyid=2012&unit=BKWH, Visited on: 19/2/2016.
-8-
ce: Researcher's calculations from data of United States Energy Information
inistration, Region Statistics, at:
://www.eia.gov/cfapps/ipdbproject/iedindex3.cfm?tid=2&pid=2&aid=12&cid=r6,&syid=19
eyid=2012&unit=BKWH, Visited on: 19/2/2016.