
Page 560 - 2016 - Vol. 40
P. 560
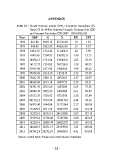
APPENDIX

Table (1) : Growth Domestic product GDP), Government Expenditure (G),

Export (X (in Million Sudanese Pounds)). Exchange Rate (EX)

and Consumer Price Index (CPI) (2007 = 100) (1992-212)

Year GDP  G          X EX CPI

1992 421.80 2903.12 25141.00 .10                                 1.32

1993 948.40 1832.98 49656.00 .13                                 3.73

1994 1881.30 1561.42 111464.0 .22                                7.99

1995 4149.40 2304.97 350075.0 1.40 13.15

1996 10478.13 1331.94 539069.0 1.25 27.59

1997 16137.37 1234.82 769528.0 1.58 40.95

1998 21935.90 2373.92 1006928 1.99 48.62

1999 27058.80 2214.30 1853219 2.52 57.80

2000 33662.70 1845.12 4832563 2.57 62.03

2001 40658.60 2615.14 4687155 2.59 69.51

2002 46701.95 2915.60 5287200 2.63 73.85

2003 54886.70 3872.59 6450880 2.61 80.89

2004 67533.39 5736.92 8735308 2.58 87.84

2005 84176.12 7916.94 10601781 2.44 94.16

2006 96935.90 9544.04 11575244 2.17 100.00

2007 115529.9 9611.32 17893359 2.02 114.30

2008 132323.0 10536.19 24612008 2.09 127.15

2009 135659.0 11758.40 17135786 2.00 143.65

2010 162203.9 12000.74 26822278 2.09 169.62

2011 186689.9 13071.17 23937092 3.24 230.00

2012 243412.8 26272.10 10862065 4.41 314.00

Source: Central Bank of Sudan and Central Bureau of Statistics.

             - 72 -