
Page 561 - 2016 - Vol. 40
P. 561
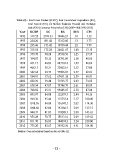
Table (2) : Real Gross Product (RGDP), Real Government Expenditure (RG),

Real Exports (RX), (in Million Sudanese Pounds) and Exchange

Rate (REX) Consumer Price Index (CPI) (2007=100) (1992-2012)

Year RGDP RG          RX REX CPI

1992 319.55 2199.33 19046.21 .10                      1.32

1993 254.26 491.42 13312.60 .13                       3.73

1994 235.46 195.42 13950.44 .22                       7.99

1995 315.54 175.28 26621.67 1.40 13.15

1996 379.78 48.28 19538.56 1.25 27.59

1997 394.07 30.15 18791.89 1.58 40.95

1998 451.17 48.83 20710.16 1.99 48.62

1999 468.15 38.31 32062.61 2.52 57.80

2000 542.68 29.75 77906.87 2.57 62.03

2001 584.93 37.62 67431.38 2.59 69.51

2002 632.39 39.48 71593.77 2.63 73.85

2003 678.54 47.87 79748.79 2.61 80.89

2004 768.82 65.31 99445.67 2.58 87.84

2005 893.97 84.08 112593.3 2.44 94.16

2006 969.36 95.44 115752.4 2.17 100.00

2007 1010.76 84.09 156547.3 2.02 114.30

2008 1040.68 82.86 193566.7 2.09 127.15

2009 944.37 81.85 119288.5 2.00 143.65

2010 956.28 70.75 158131.6 2.09 169.62

2011 811.70 56.83 104074.3 3.24 230.00

2012 775.20 83.67 34592.56 4.41 314.00

Source: Own calculations based on data of table (1).

              - 73 -