
Page 16 - English isu 43
P. 16
Mohamed Rashwan
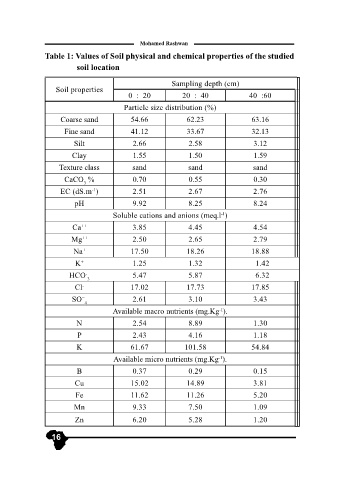
Table 1: Values of Soil physical and chemical properties of the studied
soil location
Sampling depth (cm)
Soil properties
0 : 20 20 : 40 40 :60
Particle size distribution (%)
Coarse sand 54.66 62.23 63.16
Fine sand 41.12 33.67 32.13
Silt 2.66 2.58 3.12
Clay 1.55 1.50 1.59
Texture class sand sand sand
CaCO % 0.70 0.55 0.30
3
EC (dS.m ) 2.51 2.67 2.76
-1
pH 9.92 8.25 8.24
Soluble cations and anions (meq.l )
-1
Ca ++ 3.85 4.45 4.54
Mg ++ 2.50 2.65 2.79
Na + 17.50 18.26 18.88
K + 1.25 1.32 1.42
HCO - 3 5.47 5.87 6.32
Cl - 17.02 17.73 17.85
SO = 4 2.61 3.10 3.43
-1
Available macro nutrients (mg.Kg ).
N 2.54 8.89 1.30
P 2.43 4.16 1.18
K 61.67 101.58 54.84
Available micro nutrients (mg.Kg ).
-1
B 0.37 0.29 0.15
Cu 15.02 14.89 3.81
Fe 11.62 11.26 5.20
Mn 9.33 7.50 1.09
Zn 6.20 5.28 1.20
16