
Page 8 - 2014-36
P. 8
Magnesium content
Magnesium content of okra sample was 678.72, 561.29 and
556.42 mg/100g, and of green beans sample was 637.18, 558.71 and
551.27 mg/100g for fresh, after blanching and after freezing pro-
cess, respectively. Among minerals, potassium content was often de-
creased during blanching. The authors indicate that the behavior of
minerals during blanching is related to the solubility. Potassium, the
most abundant mineral in vegetables (Sipos et al., 2009), is extremely
mobile and is easily lost by leaching during blanching because of
its high solubility in water. Calcium and magnesium are generally
bound to the plant tissue are not readily lost by leaching, and some-
times can even be taken up by vegetables during blanching from the
processing water in areas with hard water (Van den Berg et al., 2000).
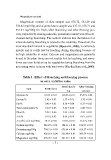
Table 1: Effect of blanching and freezing process
on okra nutritive value
Item Fresh farm After blanch- After freezing
ing process
Moisture % 83.87 ± 0.01
Protein % 1.42 ± 0.03 84.78 ± 0.03 85.92 ± 0.04
Fat % 0.46 ± 0.01 1.37 ± 0.01 1.32 ± 0.06
Total carbohydrate % 7.54 ± 0.05 0.38 ± 0.04 0.35 ± 0.02
Fiber % 5.92 ± 0.06 7.56 ± 0.03 6.80 ± 0.01
Ash % 0.79 ± 0.03 5.23 ± 0.05 4.94 ± 0.03
Ascorbic acid mg/100g 38.13 ± 0.06 0.68 ± 0.04 0.67 ± 0.01
Sodium mg/100g 226.27 ± 0.01 27.02 ± 0.03 26.57 ± 0.02
Potassium mg/100g 794.31 ± 0.03 184.61 ± 0.02 126.83 ± 0.05
Calcium mg/100g 402.56 ± 0.04 676.64 ± 0.04 656.37 ± 0.01
Magnesium mg/100g 678.72 ± 0.01 326.48 ± 0.01 309.59 ± 0.06
561.29 ± 0.05 556.42 ± 0.03
-7-